


December 08 Sales Thread


Thread Starter
Senior Moderator
Joined: Apr 2003
Posts: 47,710
Likes: 801
From: Toronto, Canada
December 08 Sales Thread
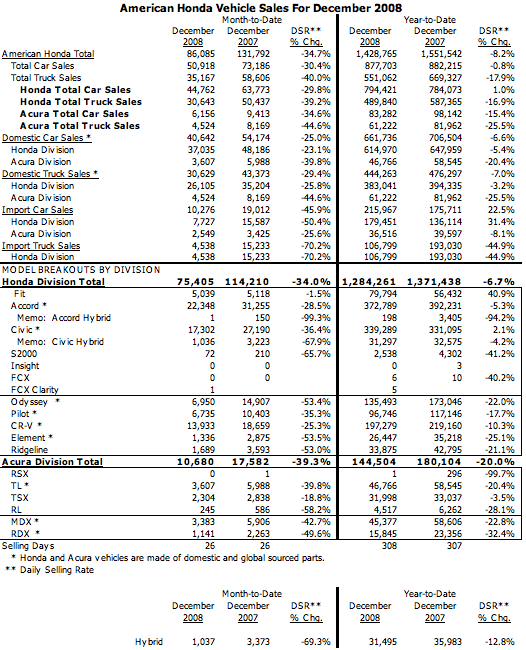
American Honda Motor Co., Inc., today reported 2008 annual vehicle sales of 1,428,765, a decrease of 8.2 percent compared to 2007 results on a daily selling-rate* basis. American Honda's December sales totaled 86,085, a decrease of 34.7 percent.
Honda Division's 2008 annual sales of 1,284,261 decreased 6.7 percent compared to 2007. Honda Division's December monthly sales of 75,405 represent a decrease of 34.0 percent compared to 2007. Annual total car sales of 794,421 for the Honda Division increased 1.0 percent and set a record for the fourth consecutive year. The division's truck sales decreased by 16.9 percent to 489,840.
Accord, the top-selling Honda model for 2008, achieved annual sales of 372,789, down 5.3 percent. December Accord sales decreased 28.5 percent, to 22,348. Civic sales totaled 339,289 for the year, up 2.1 percent. December Civic sales decreased to 17,302, down 36.4 percent. Annual Fit sales of 79,794, up 40.9 percent, set a record for the third consecutive year. December Fit sales decreased 1.5 percent, to 5,039.
"American Honda's sales mirror the industry's current condition," said Dick Colliver, executive vice president of American Honda Motor Co., Inc. "We believe Honda will be in a strong position when the market stabilizes."
The Acura Division's total year-end sales of 144,504 vehicles represented a decline of 20.0 percent. December Acura sales totaled 10,680, down 39.3 percent. The Acura TL led the division with annual sales of 46,766, followed closely by the Acura MDX with sales of 45,377 - the previous best-selling Acura in 2007.
*The annual Daily Selling Rate (DSR) is calculated with 308 days for 2008, versus 307 for 2007. Both December 2007 and 2008 included 26 selling days. All percentages in this release represent DSR.
Honda Division's 2008 annual sales of 1,284,261 decreased 6.7 percent compared to 2007. Honda Division's December monthly sales of 75,405 represent a decrease of 34.0 percent compared to 2007. Annual total car sales of 794,421 for the Honda Division increased 1.0 percent and set a record for the fourth consecutive year. The division's truck sales decreased by 16.9 percent to 489,840.
Accord, the top-selling Honda model for 2008, achieved annual sales of 372,789, down 5.3 percent. December Accord sales decreased 28.5 percent, to 22,348. Civic sales totaled 339,289 for the year, up 2.1 percent. December Civic sales decreased to 17,302, down 36.4 percent. Annual Fit sales of 79,794, up 40.9 percent, set a record for the third consecutive year. December Fit sales decreased 1.5 percent, to 5,039.
"American Honda's sales mirror the industry's current condition," said Dick Colliver, executive vice president of American Honda Motor Co., Inc. "We believe Honda will be in a strong position when the market stabilizes."
The Acura Division's total year-end sales of 144,504 vehicles represented a decline of 20.0 percent. December Acura sales totaled 10,680, down 39.3 percent. The Acura TL led the division with annual sales of 46,766, followed closely by the Acura MDX with sales of 45,377 - the previous best-selling Acura in 2007.
*The annual Daily Selling Rate (DSR) is calculated with 308 days for 2008, versus 307 for 2007. Both December 2007 and 2008 included 26 selling days. All percentages in this release represent DSR.
Hard to get an idea of how well the new TL and TSX are doing based on the market.

6G TLX-S


Joined: Dec 2000
Posts: 10,229
Likes: 1,184
From: YVR
Thread Starter
Senior Moderator
Joined: Apr 2003
Posts: 47,710
Likes: 801
From: Toronto, Canada
Sales at Ford and G.M. in December Fall More Than 31%
By NICK BUNKLEY
Published: January 5, 2009
DETROIT — Vehicle sales in the United States dropped 32.4 percent at the Ford Motor Company and 31.4 percent at General Motors in December from the month a year ago, the automakers said Monday, and their rivals were expected to report even bleaker numbers later in the afternoon.
The decline means that for all of 2008, Ford’s sales fell 20.7 percent, a difference of more than 500,000 vehicles, while G.M.’s sales were down 22.9 percent, a drop of nearly 900,000.
G.M., which received a $4 billion loan from the federal government at the end of December to help it remain solvent, cut its production forecast for the first quarter by another 180,000 vehicles, to a level 53 percent lower than the same period of 2008.
Other major automakers, including foreign and domestic brands, are expected to say that their sales fell at least 35 percent in December, according to analysts’ forecasts. The most dismal reports will likely come from Chrysler, which also received a $4 billion loan last month, and Nissan.
Smaller carmakers fared slightly better. Volkswagen sales fell 14 percent last month and 3.2 percent for the full year, while Mercedes said sales fell 23.5 percent in December and 11.2 percent for the year.
Over all, analysts say 2008 will end up as the worst year for selling cars and trucks since 1992. But that comparison does not capture how quickly business deteriorated in recent months, as credit markets tightened and consumer confidence sank.
Plummeting demand for vehicles caused Toyota last month to project its first full-year operating loss in 70 years, showing that the industry’s woes extend far beyond Detroit.
George Pipas, Ford’s chief sales analyst, projected total industry sales for 2008 of about 13.5 million, a full 3 million fewer than in 2007. Not since 1974, when an oil embargo against the United States caused the price of oil to quadruple, has the market collapsed that much in a single year, he said.
Analysts said December’s sales rate would probably be worse than even the 26-year lows reached in October and November.
“When you adjust it for population, this is something that we really haven’t seen since the 1960s,” Erich Merkle, an automotive analyst in Grand Rapids, Mich., with the consulting firm Crowe Horwath, said. “This is a really horrible cycle in terms of auto sales.”
There were some modest bright spots for Ford. The company estimated that its market share increased to 14.6 percent in December, up 0.7 of a point from a year ago. It marks the first time in 11 years that Ford’s market share rose, on a year-over-year basis, for three consecutive months.
In addition, the Ford F-series pickup appears to have maintained its position as the best-selling model in the United States for a 27th consecutive year, despite surging demand for small cars such as the Honda Civic and Toyota Corolla. Ford began selling a redesigned version of the F-series this fall.
By NICK BUNKLEY
Published: January 5, 2009
DETROIT — Vehicle sales in the United States dropped 32.4 percent at the Ford Motor Company and 31.4 percent at General Motors in December from the month a year ago, the automakers said Monday, and their rivals were expected to report even bleaker numbers later in the afternoon.
The decline means that for all of 2008, Ford’s sales fell 20.7 percent, a difference of more than 500,000 vehicles, while G.M.’s sales were down 22.9 percent, a drop of nearly 900,000.
G.M., which received a $4 billion loan from the federal government at the end of December to help it remain solvent, cut its production forecast for the first quarter by another 180,000 vehicles, to a level 53 percent lower than the same period of 2008.
Other major automakers, including foreign and domestic brands, are expected to say that their sales fell at least 35 percent in December, according to analysts’ forecasts. The most dismal reports will likely come from Chrysler, which also received a $4 billion loan last month, and Nissan.
Smaller carmakers fared slightly better. Volkswagen sales fell 14 percent last month and 3.2 percent for the full year, while Mercedes said sales fell 23.5 percent in December and 11.2 percent for the year.
Over all, analysts say 2008 will end up as the worst year for selling cars and trucks since 1992. But that comparison does not capture how quickly business deteriorated in recent months, as credit markets tightened and consumer confidence sank.
Plummeting demand for vehicles caused Toyota last month to project its first full-year operating loss in 70 years, showing that the industry’s woes extend far beyond Detroit.
George Pipas, Ford’s chief sales analyst, projected total industry sales for 2008 of about 13.5 million, a full 3 million fewer than in 2007. Not since 1974, when an oil embargo against the United States caused the price of oil to quadruple, has the market collapsed that much in a single year, he said.
Analysts said December’s sales rate would probably be worse than even the 26-year lows reached in October and November.
“When you adjust it for population, this is something that we really haven’t seen since the 1960s,” Erich Merkle, an automotive analyst in Grand Rapids, Mich., with the consulting firm Crowe Horwath, said. “This is a really horrible cycle in terms of auto sales.”
There were some modest bright spots for Ford. The company estimated that its market share increased to 14.6 percent in December, up 0.7 of a point from a year ago. It marks the first time in 11 years that Ford’s market share rose, on a year-over-year basis, for three consecutive months.
In addition, the Ford F-series pickup appears to have maintained its position as the best-selling model in the United States for a 27th consecutive year, despite surging demand for small cars such as the Honda Civic and Toyota Corolla. Ford began selling a redesigned version of the F-series this fall.
Honda down more than Ford and GM.

Race Director
iTrader: (1)
Joined: Oct 2006
Posts: 11,395
Likes: 0
From: Charlotte(home) /Raleigh (school), NC
Race Director
iTrader: (1)
Joined: Oct 2006
Posts: 11,395
Likes: 0
From: Charlotte(home) /Raleigh (school), NC
Toyota Reports 2008 and December Sales
TORRANCE, CA UNITED STATES
TORRANCE, Calif., Jan. 5 /PRNewswire/ -- Toyota Motor Sales (TMS), U.S.A., Inc., today reported year-end sales of 2,217,662 vehicles, a decrease of 15.7 percent from the same period in 2007, on a daily selling rate basis.
Toyota Division recorded year-end sales of 1,957,575 vehicles, down 14.9 percent from the prior year. Lexus reported sales of 260,087 units in 2008, down 21.2 percent from 2007. Scion Division reported sales of 113,904 units for the year.
TMS reported December sales results of 141,949, a decrease of 36.7 percent from the same period last year.
"Our New Year's resolution is to shift the focus back to where it belongs, to the consumer," said TMS President Jim Lentz. "The sooner stimulus efforts find their way to where they'll do the most good - into the hands of consumers - the sooner we'll see a turnaround in confidence levels and a return of buyers to the marketplace."
Toyota Division
Toyota Division reported December sales of 118,587 units, down 37.5 percent from December 2007. Toyota Division passenger cars recorded December sales of 67,717 units, with year-end sales of 1,207,006 units, down 8.4 percent from last year. For the year, passenger car sales were led by Camry, which posted annual sales of 436,617. Corolla posted year-end sales of 351,007. The Yaris subcompact reported best-ever year-end sales totaling 102,328, up 20.3 percent over 2007. Prius recorded sales of 158,884 units for the year.
Toyota Division light trucks reported December sales of 50,870 units, with year-end sales of 750,569, down 23.5 percent from 2007. Light truck sales were led by the Tacoma mid-size pickup, with year-end sales of 144,655 units. Tundra reported sales of 137,249 units in 2008. RAV4 compact sport utility vehicle reported year-end sales of 137,020 units for the year. Highlander and Highlander Hybrid posted combined sales of 104,661 units for the year. The Highlander Hybrid gas-electric mid-size SUV reported sales of 19,391 units in 2008. Sequoia reported year-end sales of 30,693 units, up 31.5 percent over the prior year.
Scion reported December sales of 4,127 units. The Scion xB urban utility vehicle recorded December sales of 1,794 units, with year-end sales totaling 45,220. The tC sports coupe reported December sales of 1,348 units, with year-end sales reaching 40,980 units. The xD posted sales of 985 units in December and year-end sales of 27,665 units.
Lexus Division
Lexus reported December sales of 23,362 units, down 32.4 percent from the year-ago month. Lexus passenger cars reported December sales of 11,542 units, with year-end sales of 151,567 units in 2008. Lexus passenger car sales were led by the ES entry luxury sedan with December sales of 5,236 units and year-end sales of 64,135. The IS entry luxury sport sedan recorded combined December sales of 3,539 units and combined year-end sales of 49,432 units. The LS flagship sedan reported combined December sales of 1,451 units and year-end sales of 20,255 units. The GS luxury sport sedan posted combined December sales of 1,200 units, with year-end sales totaling 15,759 units.
Lexus Division light trucks reported December sales of 11,820 units and year-end sales of 108,520 units. The RX luxury utility posted combined December sales of 9,932 units and year-end sales of 84,181 units. The RX 400h luxury hybrid SUV reported sales of 15,200 units for the year. The LX posted yearly sales of 7,915 units, up 219.7 percent over 2007.
TMS Hybrids
TMS calendar-year-to-date hybrid sales totaled 241,405 units. In December, TMS posted sales of 12,201 hybrid vehicles. Toyota Division posted December sales of 10,637 hybrids and year-end sales of 224,547 units. Lexus Division posted sales of 1,564 hybrids for the month and 16,858 units for the year.
There were 308 selling days in 2008, compared to 307 selling days in 2007. There were 26 selling days this sales month and last December.
SOURCE Toyota Motor Sales, U.S.A., Inc.
TORRANCE, CA UNITED STATES
TORRANCE, Calif., Jan. 5 /PRNewswire/ -- Toyota Motor Sales (TMS), U.S.A., Inc., today reported year-end sales of 2,217,662 vehicles, a decrease of 15.7 percent from the same period in 2007, on a daily selling rate basis.
Toyota Division recorded year-end sales of 1,957,575 vehicles, down 14.9 percent from the prior year. Lexus reported sales of 260,087 units in 2008, down 21.2 percent from 2007. Scion Division reported sales of 113,904 units for the year.
TMS reported December sales results of 141,949, a decrease of 36.7 percent from the same period last year.
"Our New Year's resolution is to shift the focus back to where it belongs, to the consumer," said TMS President Jim Lentz. "The sooner stimulus efforts find their way to where they'll do the most good - into the hands of consumers - the sooner we'll see a turnaround in confidence levels and a return of buyers to the marketplace."
Toyota Division
Toyota Division reported December sales of 118,587 units, down 37.5 percent from December 2007. Toyota Division passenger cars recorded December sales of 67,717 units, with year-end sales of 1,207,006 units, down 8.4 percent from last year. For the year, passenger car sales were led by Camry, which posted annual sales of 436,617. Corolla posted year-end sales of 351,007. The Yaris subcompact reported best-ever year-end sales totaling 102,328, up 20.3 percent over 2007. Prius recorded sales of 158,884 units for the year.
Toyota Division light trucks reported December sales of 50,870 units, with year-end sales of 750,569, down 23.5 percent from 2007. Light truck sales were led by the Tacoma mid-size pickup, with year-end sales of 144,655 units. Tundra reported sales of 137,249 units in 2008. RAV4 compact sport utility vehicle reported year-end sales of 137,020 units for the year. Highlander and Highlander Hybrid posted combined sales of 104,661 units for the year. The Highlander Hybrid gas-electric mid-size SUV reported sales of 19,391 units in 2008. Sequoia reported year-end sales of 30,693 units, up 31.5 percent over the prior year.
Scion reported December sales of 4,127 units. The Scion xB urban utility vehicle recorded December sales of 1,794 units, with year-end sales totaling 45,220. The tC sports coupe reported December sales of 1,348 units, with year-end sales reaching 40,980 units. The xD posted sales of 985 units in December and year-end sales of 27,665 units.
Lexus Division
Lexus reported December sales of 23,362 units, down 32.4 percent from the year-ago month. Lexus passenger cars reported December sales of 11,542 units, with year-end sales of 151,567 units in 2008. Lexus passenger car sales were led by the ES entry luxury sedan with December sales of 5,236 units and year-end sales of 64,135. The IS entry luxury sport sedan recorded combined December sales of 3,539 units and combined year-end sales of 49,432 units. The LS flagship sedan reported combined December sales of 1,451 units and year-end sales of 20,255 units. The GS luxury sport sedan posted combined December sales of 1,200 units, with year-end sales totaling 15,759 units.
Lexus Division light trucks reported December sales of 11,820 units and year-end sales of 108,520 units. The RX luxury utility posted combined December sales of 9,932 units and year-end sales of 84,181 units. The RX 400h luxury hybrid SUV reported sales of 15,200 units for the year. The LX posted yearly sales of 7,915 units, up 219.7 percent over 2007.
TMS Hybrids
TMS calendar-year-to-date hybrid sales totaled 241,405 units. In December, TMS posted sales of 12,201 hybrid vehicles. Toyota Division posted December sales of 10,637 hybrids and year-end sales of 224,547 units. Lexus Division posted sales of 1,564 hybrids for the month and 16,858 units for the year.
There were 308 selling days in 2008, compared to 307 selling days in 2007. There were 26 selling days this sales month and last December.
Code:
                             TOYOTA  RETAIL  SALES
                           (INCLUDES FLEET & HAWAII)
                                December, 2008

                         -- CURRENT MONTH --    -- CALENDAR YEAR TO DATE --
                                           DSR %                       DSR %
                         2008     2007     CHG      2008       2007    CHG
                         ----     ----     ---      ----       ----    ---

    YARIS               4,417    5,477   -19.4   102,328     84,799   20.3
    COROLLA            22,129   28,582   -22.6   351,007    371,390   -5.8
    CAMRY              25,275   38,831   -34.9   436,617    473,108   -8.0
    VENZA               1,474        0     N/A     1,474          0    N/A
    AVALON              2,436    5,694   -57.2    42,790     72,945  -41.5
    PRIUS               7,859   14,212   -44.7   158,884    181,221  -12.6
    SCION xA                0       14  -100.0        39      9,547  -99.6
    SCION xB            1,794    3,785   -52.6    45,220     45,834   -1.7
    SCION tC            1,348    3,507   -61.6    40,980     63,852  -36.0
    SCION xD              985    1,638   -39.9    27,665     10,948  151.9
    TOTAL TOYOTA DIV.
     PASS. CAR         67,717  101,741   -33.4 1,207,006  1,313,651   -8.4
    -----------------  ------  -------   ----- ---------  ---------   ----
    ES                  5,236    8,005   -34.6    64,135     82,867  -22.9
    LS                  1,451    3,257   -55.4    20,255     35,226  -42.7
    SC                    116      348   -66.7     1,986      3,927  -49.6
    GS                  1,200    2,579   -53.5    15,759     23,381  -32.8
    IS                  3,539    5,651   -37.4    49,432     54,933  -10.3
    TOTAL LEXUS PASS.
     CAR               11,542   19,840   -41.8   151,567    200,334  -24.6
    -----------------  ------   ------   -----   -------    -------  -----
    TOTAL TOYOTA
     PASS. CAR         79,259  121,581   -34.8 1,358,573  1,513,985  -10.6
    ------------       ------  -------   ----- ---------  ---------  -----
    SIENNA              6,901   12,350   -44.1   115,944    138,162  -16.4
    RAV4                8,795   13,816   -36.3   137,020    172,752  -20.9
    FJ CRUISER          3,168    4,079   -22.3    28,668     55,170  -48.2
    4RUNNER             3,707    7,421   -50.0    47,878     87,718  -45.6
    HIGHLANDER          7,791   14,714   -47.1   104,661    127,878  -18.4
    LAND CRUISER          227      648   -65.0     3,801      3,251   16.5
    SEQUOIA             2,399    2,567    -6.5    30,693     23,273   31.5
    TOTAL SUV          26,087   43,245   -39.7   352,721    470,042  -25.2
    ---------          ------   ------   -----   -------    -------  -----
    4X2 TACOMA          4,287    7,858   -45.4    79,773    102,696  -22.6
    4X4 TACOMA          4,404    5,431   -18.9    64,882     70,542   -8.3
    TOTAL TACOMA        8,691   13,289   -34.6   144,655    173,238  -16.8
    TUNDRA              9,191   19,219   -52.2   137,249    196,555  -30.4
    TOTAL PICKUP       17,882   32,508   -45.0   281,904    369,793  -24.0
    TOTAL TOYOTA DIV.
     LT TRUCK          50,870   88,103   -42.3   750,569    977,997  -23.5
    LX                    508      132   284.8     7,915      2,468  219.7
    GX                  1,380    2,748   -49.8    16,424     23,035  -28.9
    RX                  9,932   11,835   -16.1    84,181    103,340  -18.8
    TOTAL LEXUS
     LIGHT TRUCK       11,820   14,715   -19.7   108,520    128,843  -16.0
    ------------       ------   ------   -----   -------    -------  -----
    TOTAL TOYOTA
     LIGHT TRUCK       62,690  102,818   -39.0   859,089  1,106,840  -22.6
    ------------       ------  -------   -----   -------  ---------  -----
    TOTAL TOYOTA DIV. 118,587  189,844   -37.5 1,957,575  2,291,648  -14.9
    TOTAL LEXUS        23,362   34,555   -32.4   260,087    329,177  -21.2
    -----------        ------   ------   -----   -------    -------  -----
    TOTAL TOYOTA      141,949  224,399   -36.7 2,217,662  2,620,825  -15.7
    MEMO:
    DOM. COROLLA       17,192   28,571   -39.8   252,877    348,016  -27.6
    DOM. CAMRY         24,790   37,757   -34.3   428,841    418,757    2.1
    DOM. RAV4             210        0     N/A       247          0    N/A
    DOM. PICKUP        17,882   32,508   -45.0   281,902    369,793  -24.0
    DOM. RX             8,221    8,414    -2.3    63,610     74,351  -14.7

    SELLING DAYS           26       26               308        307
    ------------           --       --               ---        ---


    TOYOTA DIV.
     IMPORT CAR        21,825   29,719   -26.6   481,024    473,933    1.2
    LEXUS IMPORT CAR   11,542   19,840   -41.8   151,567    200,334  -24.6
    TOYOTA DIV NA
     BUILT CARS        45,892   72,022   -36.3   725,982    839,718  -13.8
    TOTAL TOYOTA CARS  79,259  121,581   -34.8 1,358,573  1,513,985  -10.6

    TOYOTA DIV.
     IMPORT LT
     TRUCK             23,478   40,678   -42.3   321,781    446,769  -28.2
    LEXUS IMPORT LT
     TRUCK              3,599    6,301   -42.9    44,910     54,492  -17.9
    TOYOTA DIV NA
     BUILT LT TRUCK    27,392   47,425   -42.2   428,788    531,228  -19.5
    LEXUS NA BUILT
     LT TRUCK           8,221    8,414    -2.3    63,610     74,351  -14.7
    TOTAL TOYOTA LT
     TRUCK             62,690  102,818   -39.0   859,089  1,106,840  -22.6
    ---------------    ------  -------   -----   -------  ---------  -----

    SPORT UTILITY
     VEHICLES          34,739   53,881   -35.5   432,573    543,715  -20.7
       Memo: Lexus
        Sport Utility  11,820   14,715   -19.7   108,520    128,843  -16.0

    SMALL VANS          6,901   12,350   -44.1   115,944    138,162  -16.4
    PICKUPS            17,882   32,508   -45.0   281,904    369,793  -24.0

    ----------------
    * NORTH AMERICAN
     BUILT VEHICLES
    COROLLA            17,192   28,571   -39.8   252,877    348,016  -27.6
    CAMRY              24,790   37,757   -34.3   428,841    418,757    2.1
    VENZA               1,474        0     N/A     1,474          0    N/A
    AVALON              2,436    5,694   -57.2    42,790     72,945  -41.5
    SIENNA              6,901   12,350   -44.1   115,944    138,162  -16.4
    RAV4                  210        0     N/A       247          0    N/A
    PICKUP             17,882   32,508   -45.0   281,902    369,793  -24.0
    SEQUOIA             2,399    2,567    -6.5    30,693     23,273   31.5
    RX                  8,221    8,414    -2.3    63,610     74,351  -14.7
    TOTAL              81,505  127,861   -36.3 1,218,378  1,445,297  -16.0
    N.A. VEHICLES %
     OF TOTAL            57.4%    57.0%             54.9%      55.1%

    SELLING DAYS           26       26               308        307
    DSR = DAILY SELLING RATE
Race Director
iTrader: (1)
Joined: Oct 2006
Posts: 11,395
Likes: 0
From: Charlotte(home) /Raleigh (school), NC
01.05.2009 , Franklin, Tenn.
NISSAN NORTH AMERICA ANNOUNCES DECEMBER SALES
FRANKLIN, Tenn. (January 5, 2009) – Nissan North America, Inc. (NNA) today reported sales for December of 62,102 units versus 89,555 units a year ago, a decrease of 30.7 percent. Sales of Nissan Division vehicles decreased 30.0 percent, while sales of Infiniti vehicles decreased by 34.6 percent.
NISSAN HIGHLIGHTS
* Nissan vehicles saw sales of 53,829 units in December compared with 76,900 units sold in December 2007, a 30.0 percent decrease.
* Nissan’s crossovers experienced a strong December, with sales of the Rogue up 10.0 percent from the prior year with 6,916 units, and sales of Murano up 53.9 percent, at 6,461 units.
* For the 2008 calendar year, Nissan sales totaled 838,361 units, a decrease of 10.9 percent from 941,200 in 2007.
INFINITI HIGHLIGHTS
* Infiniti sales for December were 8,273 units, down from 12,655 a year ago, a decline of 34.6 percent.
* For the 2008 calendar year, Infiniti sales totaled 112,989 units, a decrease of 11.1 percent from 127,038 in 2007.
NNA INFORMATION
* Combined sales for Nissan and Infiniti of 62,102 units, compared with last December’s sales of 89,555 units, marked a decrease of 30.7 percent.
* For the 2008 calendar year, combined sales of Nissan and Infiniti totaled 951,350 units, a 10.9 percent decrease from 2007.
* To ensure consistency in our global sales reporting, Nissan North America calculates monthly variances on a straight-percentage basis, unadjusted for the number of selling days in the month. This December had 26 selling days, as did December 2007.
In North America, Nissan's operations include automotive styling, engineering, consumer and corporate financing, sales and marketing, distribution and manufacturing. Nissan is dedicated to improving the environment under the Nissan Green Program 2010, whose key priorities are reducing CO2 emissions, cutting other emissions and increasing recycling. More information on Nissan in North America and the complete line of Nissan and Infiniti vehicles can be found online at www.NissanUSA.com and www.infiniti.com.
NISSAN NORTH AMERICA ANNOUNCES DECEMBER SALES
FRANKLIN, Tenn. (January 5, 2009) – Nissan North America, Inc. (NNA) today reported sales for December of 62,102 units versus 89,555 units a year ago, a decrease of 30.7 percent. Sales of Nissan Division vehicles decreased 30.0 percent, while sales of Infiniti vehicles decreased by 34.6 percent.
NISSAN HIGHLIGHTS
* Nissan vehicles saw sales of 53,829 units in December compared with 76,900 units sold in December 2007, a 30.0 percent decrease.
* Nissan’s crossovers experienced a strong December, with sales of the Rogue up 10.0 percent from the prior year with 6,916 units, and sales of Murano up 53.9 percent, at 6,461 units.
* For the 2008 calendar year, Nissan sales totaled 838,361 units, a decrease of 10.9 percent from 941,200 in 2007.
INFINITI HIGHLIGHTS
* Infiniti sales for December were 8,273 units, down from 12,655 a year ago, a decline of 34.6 percent.
* For the 2008 calendar year, Infiniti sales totaled 112,989 units, a decrease of 11.1 percent from 127,038 in 2007.
NNA INFORMATION
* Combined sales for Nissan and Infiniti of 62,102 units, compared with last December’s sales of 89,555 units, marked a decrease of 30.7 percent.
* For the 2008 calendar year, combined sales of Nissan and Infiniti totaled 951,350 units, a 10.9 percent decrease from 2007.
* To ensure consistency in our global sales reporting, Nissan North America calculates monthly variances on a straight-percentage basis, unadjusted for the number of selling days in the month. This December had 26 selling days, as did December 2007.
In North America, Nissan's operations include automotive styling, engineering, consumer and corporate financing, sales and marketing, distribution and manufacturing. Nissan is dedicated to improving the environment under the Nissan Green Program 2010, whose key priorities are reducing CO2 emissions, cutting other emissions and increasing recycling. More information on Nissan in North America and the complete line of Nissan and Infiniti vehicles can be found online at www.NissanUSA.com and www.infiniti.com.
Race Director
iTrader: (1)
Joined: Oct 2006
Posts: 11,395
Likes: 0
From: Charlotte(home) /Raleigh (school), NC
Daimler AG Reports a 23.5 Percent Decrease for the Mercedes-Benz Cars Division in the U.S. for December 2008
January 5, 2009
- Total 20,848 of Units of Mercedes-Benz Cars Division Sold in U.S.
- Mercedes-Benz USA Records December Sales of 18,507
- smart USA Records 2,341 Sales in December
NEW YORK, Jan. 5 /PRNewswire-FirstCall/ -- Daimler AG (stock exchange abbreviaton DAI) today reported sales for the Mercedes-Benz Cars division (Mercedes-Benz and smart combined) of 20,848 units in the U.S. for December 2008. All sales figures in this release are on an unadjusted basis unless otherwise noted.
Mercedes-Benz USA (MBUSA) reported December sales of 18,507 vehicles, bringing the company's total 2008 volume to 225,128, an 11.2 percent decrease over last year's annual sales record. Sales of the C-Class model line rose 13.8 percent for the year, and sales of the M-Class SUV line-up increased by 1.3 percent.
smart USA recorded 2,341 sales in December 2008. Year-to-date sales for 2008 are an incredible 24,622 units. smart USA achieved this impressive sales volume in its first year of business in the U.S. market. American response indicates the micro-car segment is a viable transportation option and the smart fortwo is the right car at the right time in the U.S. The smart fortwo offers a powerful combination of outstanding fuel efficiency, innovative safety features, environmental friendliness and excellent value. The smart fortwo BRABUS will go on sale in the United States this January. There are currently 74 smart centers open in 35 states.
Detailed vehicle sales information for MBUSA will be announced later today in a separate press release issued by Mercedes-Benz USA.
Mercedes-Benz Cars Division in the U.S. Sales Summary
Through December 2008
Month Sales % Sales CYTD %
Curr Yr Pr Yr Change Curr Yr Pr Yr Change
------- ----- ------ ------- ----- ------
Mercedes-Benz USA 18,507 27,269 -32.1% 225,128 253,433 -11.2%
smart USA 2,341 n/a* n/a* 24,622 n/a* n/a*
Mercedes-Benz USA/
smart USA combined 20,848 27,269* -23.5%* 249,750 253,433* -1.5%*
* smart sales in the U.S. started in mid January 2008
Further information on Daimler is available on the internet at www.media.daimler.com
About Daimler
Daimler AG, Stuttgart, with its businesses Mercedes-Benz Cars, Daimler Trucks, Daimler Financial Services, Mercedes-Benz Vans and Daimler Buses, is a globally leading producer of premium passenger cars and the largest manufacturer of commercial vehicles in the world. The Daimler Financial Services division has a broad offering of financial services, including vehicle financing, leasing, insurance and fleet management.
Daimler sells its products in nearly all the countries of the world and has production facilities on five continents. The company's founders, Gottlieb Daimler and Carl Benz, continued to make automotive history following their invention of the automobile in 1886. As an automotive pioneer, Daimler and its employees willingly accept an obligation to act responsibly towards society and the environment and to shape the future of safe and sustainable mobility with groundbreaking technologies and high-quality products. The current brand portfolio includes the world's most valuable automobile brand,
Mercedes-Benz, as well as smart, AMG, Maybach, Freightliner, Sterling, Western Star, Mitsubishi Fuso, Setra, Orion and Thomas Built Buses. The company is listed on the stock exchanges in Frankfurt, New York and Stuttgart (stock exchange abbreviation DAI). In 2007, the Group sold 2.1 million vehicles and employed a workforce of over 270,000 people; revenue totaled euro 99.4 billion and EBIT amounted to euro 8.7 billion. Daimler is an automotive Group with a commitment to excellence, and aims to achieve sustainable growth and industry-leading profitability.
SOURCE Daimler AG
January 5, 2009
- Total 20,848 of Units of Mercedes-Benz Cars Division Sold in U.S.
- Mercedes-Benz USA Records December Sales of 18,507
- smart USA Records 2,341 Sales in December
NEW YORK, Jan. 5 /PRNewswire-FirstCall/ -- Daimler AG (stock exchange abbreviaton DAI) today reported sales for the Mercedes-Benz Cars division (Mercedes-Benz and smart combined) of 20,848 units in the U.S. for December 2008. All sales figures in this release are on an unadjusted basis unless otherwise noted.
Mercedes-Benz USA (MBUSA) reported December sales of 18,507 vehicles, bringing the company's total 2008 volume to 225,128, an 11.2 percent decrease over last year's annual sales record. Sales of the C-Class model line rose 13.8 percent for the year, and sales of the M-Class SUV line-up increased by 1.3 percent.
smart USA recorded 2,341 sales in December 2008. Year-to-date sales for 2008 are an incredible 24,622 units. smart USA achieved this impressive sales volume in its first year of business in the U.S. market. American response indicates the micro-car segment is a viable transportation option and the smart fortwo is the right car at the right time in the U.S. The smart fortwo offers a powerful combination of outstanding fuel efficiency, innovative safety features, environmental friendliness and excellent value. The smart fortwo BRABUS will go on sale in the United States this January. There are currently 74 smart centers open in 35 states.
Detailed vehicle sales information for MBUSA will be announced later today in a separate press release issued by Mercedes-Benz USA.
Mercedes-Benz Cars Division in the U.S. Sales Summary
Through December 2008
Month Sales % Sales CYTD %
Curr Yr Pr Yr Change Curr Yr Pr Yr Change
------- ----- ------ ------- ----- ------
Mercedes-Benz USA 18,507 27,269 -32.1% 225,128 253,433 -11.2%
smart USA 2,341 n/a* n/a* 24,622 n/a* n/a*
Mercedes-Benz USA/
smart USA combined 20,848 27,269* -23.5%* 249,750 253,433* -1.5%*
* smart sales in the U.S. started in mid January 2008
Further information on Daimler is available on the internet at www.media.daimler.com
About Daimler
Daimler AG, Stuttgart, with its businesses Mercedes-Benz Cars, Daimler Trucks, Daimler Financial Services, Mercedes-Benz Vans and Daimler Buses, is a globally leading producer of premium passenger cars and the largest manufacturer of commercial vehicles in the world. The Daimler Financial Services division has a broad offering of financial services, including vehicle financing, leasing, insurance and fleet management.
Daimler sells its products in nearly all the countries of the world and has production facilities on five continents. The company's founders, Gottlieb Daimler and Carl Benz, continued to make automotive history following their invention of the automobile in 1886. As an automotive pioneer, Daimler and its employees willingly accept an obligation to act responsibly towards society and the environment and to shape the future of safe and sustainable mobility with groundbreaking technologies and high-quality products. The current brand portfolio includes the world's most valuable automobile brand,
Mercedes-Benz, as well as smart, AMG, Maybach, Freightliner, Sterling, Western Star, Mitsubishi Fuso, Setra, Orion and Thomas Built Buses. The company is listed on the stock exchanges in Frankfurt, New York and Stuttgart (stock exchange abbreviation DAI). In 2007, the Group sold 2.1 million vehicles and employed a workforce of over 270,000 people; revenue totaled euro 99.4 billion and EBIT amounted to euro 8.7 billion. Daimler is an automotive Group with a commitment to excellence, and aims to achieve sustainable growth and industry-leading profitability.
SOURCE Daimler AG
Trending Topics
You'll Never Walk Alone
iTrader: (1)
Joined: Jun 2005
Posts: 9,529
Likes: 852
From: Vancouver, BC, Canada



Senior Moderator
Joined: Jan 2001
Posts: 34,937
Likes: 638
From: Chicago Burbs
The U.S. auto industry hasn't experienced a worse year of sales in recent memory, so it's fitting that 2008 should close with December sales data that's no better than the previous disappointing months.
The only green you'll see below is next to MINI, which beat out December 2007 sales by only four vehicles. Every other automaker and its brands sold fewer cars this past month than the year prior.
Santa apparently wasn't putting Accords and Camrys under anyone's tree, as Toyota and Honda sales fell sharply, off 36.7% and 34.7%, respectively. General Motors (-31.4%) and Ford Motor Company (-32.4%) fared about the same, but the Chrysler Group took an unprecedented hit on the chin for a full-line automaker. It's December 2008 sales were down a full 53% versus last year. Chrysler brand sales alone were down an incredible 59.8% compared to 12/07. This means that HUMMER, for the first time in a long time, was not this month's Biggest Loser, managing to unload enough H3s to see sales fall by "only" 59.3%.
Props are also awarded to Audi (-9.3%), Lincoln (-10%), Subaru (-7.7%) and Volkswagen (-14.4%) who finished the year strong... well, as strong as could be expected.
The only green you'll see below is next to MINI, which beat out December 2007 sales by only four vehicles. Every other automaker and its brands sold fewer cars this past month than the year prior.
Santa apparently wasn't putting Accords and Camrys under anyone's tree, as Toyota and Honda sales fell sharply, off 36.7% and 34.7%, respectively. General Motors (-31.4%) and Ford Motor Company (-32.4%) fared about the same, but the Chrysler Group took an unprecedented hit on the chin for a full-line automaker. It's December 2008 sales were down a full 53% versus last year. Chrysler brand sales alone were down an incredible 59.8% compared to 12/07. This means that HUMMER, for the first time in a long time, was not this month's Biggest Loser, managing to unload enough H3s to see sales fall by "only" 59.3%.
Props are also awarded to Audi (-9.3%), Lincoln (-10%), Subaru (-7.7%) and Volkswagen (-14.4%) who finished the year strong... well, as strong as could be expected.
<style type="text/css"> #comparechart { border: 2px solid #333; border-collapse: collapse; } #comparechart td { padding: 3px; border: 1px solid #ccc; vertical-align: top; margin: 0; line-height: 1.3em; font-size: 80%} #comparechart th { font-size: 80%; font-weight: bold; text-align: left; padding: 4px; background: #eee; } #comparechart th.mainth { font-size: 75%; border-bottom: 1px solid #333; } #comparechart td.red { background-color: #f08c85; } #comparechart td.green { background-color: #b3e2c4; } #comparechart td.yellow { background-color: #ffffcc;} </style> <table id="comparechart" width="580" cellspacing="0" height="112"> <tbody> <tr> <th colspan="7">BY THE NUMBERS - December 2008</th> </tr> <tr> <th class="mainth">Brand</th> <th class="mainth">Vol. % Change</th> <th class="mainth">Total Sales 12/08</th> <th class="mainth">Total Sales 12/07</th> <th class="mainth">DSR % Change</th> <th class="mainth">Daily Avg. 12/08</th> <th class="mainth">Daily Avg. 12/07</th> </tr> <tr> <td>Acura
</td> <td class="red">-39.3%</td> <td>10,680</td> <td>17,582</td> <td class="red">-39.3%</td> <td>411</td> <td>676</td> </tr> <tr> <td valign="top">Audi</td> <td class="red">-9.3% </td> <td valign="top">7,712 </td> <td valign="top">8,504 </td> <td class="red">-9.3% </td> <td valign="top">297 </td> <td valign="top">327 </td> </tr> <tr> <td valign="top">BMW</td> <td class="red">-40.2% </td> <td valign="top">18,060 </td> <td valign="top">30,199 </td> <td class="red">-40.2% </td> <td valign="top">695 </td> <td valign="top">1,162 </td> </tr> <tr> <td valign="top">Buick</td> <td class="red">-38.1% </td> <td valign="top">8,909 </td> <td valign="top">14,400 </td> <td class="red">-38.1% </td> <td valign="top">343 </td> <td valign="top">554 </td> </tr> <tr> <td valign="top">Cadillac</td> <td class="red">-38.3% </td> <td valign="top">13,235 </td> <td valign="top">21,436 </td> <td class="red">-38.3% </td> <td valign="top">509 </td> <td valign="top">824 </td> </tr> <tr> <td valign="top">Chevrolet</td> <td class="red">-25.8% </td> <td valign="top">137,691 </td> <td valign="top">185,626 </td> <td class="red">-25.8% </td> <td valign="top">5,296 </td> <td valign="top">7,139 </td> </tr> <tr> <td valign="top">Chrysler</td> <td class="red">-59.8% </td> <td valign="top">19,453 </td> <td valign="top">48,384 </td> <td class="red">-59.8% </td> <td valign="top">748 </td> <td valign="top">1,861 </td> </tr> <tr> <td valign="top">Dodge</td> <td class="red">-51.9% </td> <td valign="top">47,269 </td> <td valign="top">98,235 </td> <td class="red">-51.9% </td> <td valign="top">1,818 </td> <td valign="top">3,778 </td> </tr> <tr> <td valign="top">Ford</td> <td class="red">-33% </td> <td valign="top">116,188 </td> <td valign="top">173,648 </td> <td class="red">-33% </td> <td valign="top">4,469 </td> <td valign="top">6,679 </td> </tr> <tr> <td valign="top">GMC</td> <td class="red">-34.5% </td> <td valign="top">29,783 </td> <td valign="top">45,503 </td> <td class="red">-34.5% </td> <td valign="top">1,146 </td> <td valign="top">1,750 </td> </tr> <tr> <td valign="top">Honda</td> <td class="red">-34% </td> <td valign="top">75,405 </td> <td valign="top">114,210 </td> <td class="red">-34% </td> <td valign="top">2,900 </td> <td valign="top">4,393 </td> </tr> <tr> <td valign="top">HUMMER</td> <td class="red">-59.3% </td> <td valign="top">2,170 </td> <td valign="top">5,333 </td> <td class="red">-59.3% </td> <td valign="top">83 </td> <td valign="top">205 </td> </tr> <tr> <td valign="top">Hyundai</td> <td class="red"> NA</td> <td valign="top">
</td> <td valign="top">
</td> <td class="red">
</td> <td valign="top">
</td> <td valign="top">
</td> </tr> <tr> <td valign="top">Infiniti</td> <td class="red">-34.6%</td> <td valign="top">8,273</td> <td valign="top">12,655</td> <td class="red">-34.6%</td> <td valign="top">318</td> <td valign="top">487</td> </tr> <tr> <td valign="top">Jeep</td> <td class="red">-48.5% </td> <td valign="top">23,091 </td> <td valign="top">44,804 </td> <td class="red">-48.5% </td> <td valign="top">888 </td> <td valign="top">1,723 </td> </tr> <tr> <td valign="top">Kia</td> <td class="red">-39.2%</td> <td valign="top">14,644</td> <td valign="top">24,068</td> <td class="red">-39.2%</td> <td valign="top">563</td> <td valign="top">926</td> </tr> <tr> <td valign="top">Lexus</td> <td class="red">-32.4% </td> <td valign="top">23,362 </td> <td valign="top">34,555 </td> <td class="red">-32.4% </td> <td valign="top">899 </td> <td valign="top">1,329 </td> </tr> <tr> <td valign="top">Lincoln</td> <td class="red">-10% </td> <td valign="top">9,053 </td> <td valign="top">10,065 </td> <td class="red">-10% </td> <td valign="top">348 </td> <td valign="top">387 </td> </tr> <tr> <td valign="top">Mazda</td> <td class="red"> -27.9%</td> <td valign="top">17,965</td> <td valign="top">24,933</td> <td class="red">-27.9%</td> <td valign="top">691</td> <td valign="top">959</td> </tr> <tr> <td valign="top">Mercedes-Benz</td> <td class="red">-32.1%</td> <td valign="top">18,507</td> <td valign="top">27,269</td> <td class="red">-32.1%</td> <td valign="top">711</td> <td valign="top">1,049</td> </tr> <tr> <td valign="top">Mercury</td> <td class="red">-29.8% </td> <td valign="top">8,873 </td> <td valign="top">12,631 </td> <td class="red">-29.8% </td> <td valign="top">341 </td> <td valign="top">486 </td> </tr> <tr> <td valign="top">MINI</td> <td class="green">0.1% </td> <td valign="top">3,566 </td> <td valign="top">3,562 </td> <td class="green">0.1%</td> <td valign="top">137 </td> <td valign="top">137 </td> </tr> <tr> <td valign="top">Mitsubishi</td> <td class="red">-22.6%</td> <td valign="top">4,570</td> <td valign="top">5,904</td> <td class="red">-22.6%</td> <td valign="top">176</td> <td valign="top">227</td> </tr> <tr> <td valign="top">Nissan</td> <td class="red">-30%</td> <td valign="top">53,829</td> <td valign="top">76,900</td> <td class="red">-30%</td> <td valign="top">2,070</td> <td valign="top">2,958</td> </tr> <tr> <td valign="top">Pontiac</td> <td class="red">-45.5% </td> <td valign="top">16,466 </td> <td valign="top">30,211 </td> <td class="red">-45.5% </td> <td valign="top">633 </td> <td valign="top">1,162 </td> </tr> <tr> <td valign="top">Porsche</td> <td class="red">-25.5%</td> <td valign="top">2,154</td> <td valign="top">2,891</td> <td class="red">-25.5%</td> <td valign="top">82</td> <td valign="top">111</td> </tr> <tr> <td valign="top">Saab</td> <td class="red">-57% </td> <td valign="top">1,179 </td> <td valign="top">2,748 </td> <td class="red">-57% </td> <td valign="top">45 </td> <td valign="top">106 </td> </tr> <tr> <td valign="top">Saturn</td> <td class="red">-30.9% </td> <td valign="top">12,570</td> <td valign="top">18,196 </td> <td class="red">-30.9% </td> <td valign="top">483 </td> <td valign="top">700 </td> </tr> <tr> <td valign="top">Subaru</td> <td class="red">-7.7%</td> <td valign="top">17,287</td> <td valign="top">18,739</td> <td class="red">-7.7%</td> <td valign="top">664</td> <td valign="top">721</td> </tr> <tr> <td valign="top">Suzuki</td> <td class="red"> NA</td> <td valign="top">
</td> <td valign="top">
</td> <td class="red">
</td> <td valign="top">
</td> <td valign="top">
</td> </tr> <tr> <td valign="top">Toyota</td> <td class="red">-37.5% </td> <td valign="top">118,587 </td> <td valign="top">189,844 </td> <td class="red">-37.5% </td> <td valign="top">4,561 </td> <td valign="top">7,302 </td> </tr> <tr> <td valign="top">Volkswagen</td> <td class="red">-14.4%</td> <td valign="top">17,577</td> <td valign="top">20,543</td> <td class="red">-14.4%</td> <td valign="top">676</td> <td valign="top">790</td> </tr> <tr> <td valign="top">Volvo</td> <td class="red">-47% </td> <td valign="top">4,953 </td> <td valign="top">9,341 </td> <td class="red">-47% </td> <td valign="top">191 </td> <td valign="top">359 </td> </tr> <tr> <td class="yellow"> COMPANIES</td> <td class="yellow">
</td> <td class="yellow">
</td> <td class="yellow">
</td> <td class="yellow">
</td> <td class="yellow">
</td> <td class="yellow">
</td> </tr> <tr> <td valign="top">BMW Group</td> <td class="red">-35.9%
</td> <td valign="top">21,626
</td> <td valign="top">33,761
</td> <td class="red">-35.9%
</td> <td valign="top">832
</td> <td valign="top">1,299
</td> </tr> <tr> <td valign="top">Chrysler LLC</td> <td class="red">-53% </td> <td valign="top">89,813 </td> <td valign="top">191,423 </td> <td class="red">-53% </td> <td valign="top">3,454 </td> <td valign="top">7,362 </td> </tr> <tr> <td valign="top">FoMoCo</td> <td class="red">-32.4% </td> <td valign="top">139,067 </td> <td valign="top">205,685 </td> <td class="red">-32.4% </td> <td valign="top">5,349 </td> <td valign="top">7,911 </td> </tr> <tr> <td valign="top">General Motors</td> <td class="red">-31.4% </td> <td valign="top">221,983 </td> <td valign="top">323,453 </td> <td class="red">-31.4% </td> <td valign="top">8,538 </td> <td valign="top">12,441 </td> </tr> <tr> <td valign="top">Honda America</td> <td class="red">-34.7%
</td> <td valign="top">86,085
</td> <td valign="top">131,792
</td> <td class="red">-34.7%
</td> <td valign="top">3,311
</td> <td valign="top">5,069
</td> </tr> <tr> <td valign="top">Nissan NA</td> <td class="red">-30.1%</td> <td valign="top">62,102</td> <td valign="top">89,555</td> <td class="red">-30.1%</td> <td valign="top">2,389</td> <td valign="top">3,444</td> </tr> <tr> <td valign="top">Toyota Mo Co</td> <td class="red">-36.7%
</td> <td valign="top">141,949 </td> <td valign="top">224,399 </td> <td class="red">-36.7% </td> <td valign="top">5,460 </td> <td valign="top">8,631 </td> </tr> </tbody> </table>
December 2008 had 26 selling days versus 26 selling days for December 2007.
Senior Moderator
Joined: Jan 2001
Posts: 34,937
Likes: 638
From: Chicago Burbs
<table id="comparechart" width="580" cellspacing="0" height="112"><tbody><tr><th colspan="7">BY THE NUMBERS - 2008</th> </tr> <tr> <th class="mainth">Brand</th> <th class="mainth">Vol. % Change</th> <th class="mainth">Total Sales 2008</th> <th class="mainth">Total Sales 2007</th> <th class="mainth">DSR % Change</th> <th class="mainth">Daily Avg. 2008</th> <th class="mainth">Daily Avg. 2007</th> </tr> <tr> <td>Acura
</td> <td class="red">-19.8%
</td> <td>144,504
</td> <td>180,104
</td> <td class="red">-20%
</td> <td>469
</td> <td>587
</td> </tr> <tr> <td valign="top">Audi</td> <td class="red">-6.1% </td> <td valign="top">87,760 </td> <td valign="top">93,506 </td> <td class="red">-6.4% </td> <td valign="top">285 </td> <td valign="top">305 </td> </tr> <tr> <td valign="top">BMW</td> <td class="red">-15.2% </td> <td valign="top">249,113 </td> <td valign="top">293,795 </td> <td class="red">-15.5% </td> <td valign="top">809 </td> <td valign="top">957 </td> </tr> <tr> <td valign="top">Buick</td> <td class="red">-26.2% </td> <td valign="top">137,197 </td> <td valign="top">185,791 </td> <td class="red">-26.4% </td> <td valign="top">445 </td> <td valign="top">605 </td> </tr> <tr> <td valign="top">Cadillac</td> <td class="red">-24.9% </td> <td valign="top">161,159 </td> <td valign="top">214,726 </td> <td class="red">-25.2% </td> <td valign="top">523 </td> <td valign="top">699 </td> </tr> <tr> <td valign="top">Chevrolet</td> <td class="red">-20.5% </td> <td valign="top">1,801,131 </td> <td valign="top">2,265,641 </td> <td class="red">-20.8% </td> <td valign="top">5,848 </td> <td valign="top">7,380 </td> </tr> <tr> <td valign="top">Chrysler</td> <td class="red">-38.3% </td> <td valign="top">335,108 </td> <td valign="top">543,011 </td> <td class="red">-38.5% </td> <td valign="top">1,088 </td> <td valign="top">1,769 </td> </tr> <tr> <td valign="top">Dodge</td> <td class="red">-25.9% </td> <td valign="top">784,113 </td> <td valign="top">1,058,402 </td> <td class="red">-26.2% </td> <td valign="top">2,546 </td> <td valign="top">3,448 </td> </tr> <tr> <td valign="top">Ford</td> <td class="red">-19.7% </td> <td valign="top">1,687,731 </td> <td valign="top">2,101,244 </td> <td class="red">-19.9% </td> <td valign="top">5,480 </td> <td valign="top">6,844 </td> </tr> <tr> <td valign="top">GMC</td> <td class="red">-25.5% </td> <td valign="top">376,996 </td> <td valign="top">505,746 </td> <td class="red">-25.7% </td> <td valign="top">1,224 </td> <td valign="top">1,647 </td> </tr> <tr> <td valign="top">Honda</td> <td class="red">-6.4% </td> <td valign="top">1,284,261 </td> <td valign="top">1,371,438 </td> <td class="red">-6.7% </td> <td valign="top">4,170 </td> <td valign="top">4,467 </td> </tr> <tr> <td valign="top">HUMMER</td> <td class="red">-50.9% </td> <td valign="top">27,485 </td> <td valign="top">55,986 </td> <td class="red">-51% </td> <td valign="top">89 </td> <td valign="top">182 </td> </tr> <tr> <td valign="top">Hyundai</td> <td class="red">NA </td> <td valign="top">
</td> <td valign="top">
</td> <td class="red">
</td> <td valign="top">
</td> <td valign="top">
</td> </tr> <tr> <td valign="top">Infiniti</td> <td class="red">-11% </td> <td valign="top">112,989 </td> <td valign="top">127,038 </td> <td class="red">-11.3% </td> <td valign="top">367 </td> <td valign="top">414 </td> </tr> <tr> <td valign="top">Jeep</td> <td class="red">-29.7% </td> <td valign="top">333,901</td> <td valign="top">475,237 </td> <td class="red">-30% </td> <td valign="top">1,084</td> <td valign="top">1,548 </td> </tr> <tr> <td valign="top">Kia</td> <td class="red">-10.5% </td> <td valign="top">273,397 </td> <td valign="top">305,473 </td> <td class="red">-10.8% </td> <td valign="top">888 </td> <td valign="top">995 </td> </tr> <tr> <td valign="top">Lexus</td> <td class="red">-21% </td> <td valign="top">260,087 </td> <td valign="top">329,177 </td> <td class="red">-21.2% </td> <td valign="top">844 </td> <td valign="top">1,072 </td> </tr> <tr> <td valign="top">Lincoln</td> <td class="red">-18.4% </td> <td valign="top">107,295 </td> <td valign="top">131,487 </td> <td class="red">-18.7% </td> <td valign="top">348 </td> <td valign="top">428 </td> </tr> <tr> <td valign="top">Mazda</td> <td class="red">-10.9% </td> <td valign="top">263,949 </td> <td valign="top">296,110 </td> <td class="red">-11.2% </td> <td valign="top">857 </td> <td valign="top">965 </td> </tr> <tr> <td valign="top">Mercedes-Benz</td> <td class="red">-11.2% </td> <td valign="top">225,128 </td> <td valign="top">253,433 </td> <td class="red">-11.5% </td> <td valign="top">731 </td> <td valign="top">826 </td> </tr> <tr> <td valign="top">Mercury</td> <td class="red">-28.6% </td> <td valign="top">120,248 </td> <td valign="top">168,422 </td> <td class="red">-28.8% </td> <td valign="top">390 </td> <td valign="top">549 </td> </tr> <tr> <td valign="top">MINI</td> <td class="green">28.6% </td> <td valign="top">54,077 </td> <td valign="top">42,045 </td> <td class="green">28.2% </td> <td valign="top">176 </td> <td valign="top">137 </td> </tr> <tr> <td valign="top">Mitsubishi</td> <td class="red">-24.6% </td> <td valign="top">97,257 </td> <td valign="top">128,993 </td> <td class="red">-24.8% </td> <td valign="top">316 </td> <td valign="top">420 </td> </tr> <tr> <td valign="top">Nissan</td> <td class="red">-10.9% </td> <td valign="top">838,361 </td> <td valign="top">941,200 </td> <td class="red">-11.2% </td> <td valign="top">2,722 </td> <td valign="top">3,066 </td> </tr> <tr> <td valign="top">Pontiac</td> <td class="red">-25.3% </td> <td valign="top">267,348 </td> <td valign="top">358,022 </td> <td class="red">-25.6% </td> <td valign="top">868 </td> <td valign="top">1,166 </td> </tr> <tr> <td valign="top">Porsche</td> <td class="red">-25% </td> <td valign="top">26,035 </td> <td valign="top">34,693 </td> <td class="red">-25.2% </td> <td valign="top">85 </td> <td valign="top">113 </td> </tr> <tr> <td valign="top">Saab</td> <td class="red">-34.7% </td> <td valign="top">21,368 </td> <td valign="top">32,711 </td> <td class="red">-34.9% </td> <td valign="top">69 </td> <td valign="top">107 </td> </tr> <tr> <td valign="top">Saturn</td> <td class="red">-21.7% </td> <td valign="top">188,004 </td> <td valign="top">240,091 </td> <td class="red">-21.9% </td> <td valign="top">610 </td> <td valign="top">782 </td> </tr> <tr> <td valign="top">Subaru</td> <td class="green">0.3% </td> <td valign="top">187,699 </td> <td valign="top">187,208 </td> <td class="red">-0.06 </td> <td valign="top">609 </td> <td valign="top">610 </td> </tr> <tr> <td valign="top">Suzuki</td> <td class="red">NA </td> <td valign="top">
</td> <td valign="top">
</td> <td class="red">
</td> <td valign="top">
</td> <td valign="top">
</td> </tr> <tr> <td valign="top">Toyota</td> <td class="red">-14.6% </td> <td valign="top">1,957,575 </td> <td valign="top">2,291,648 </td> <td class="red">-14.9% </td> <td valign="top">6,356 </td> <td valign="top">7,464 </td> </tr> <tr> <td valign="top">Volkswagen</td> <td class="red">-3.2% </td> <td valign="top">223,128 </td> <td valign="top">230,572 </td> <td class="red">-3.5% </td> <td valign="top">724 </td> <td valign="top">751 </td> </tr> <tr> <td valign="top">Volvo</td> <td class="red">-31.2% </td> <td valign="top">73,102 </td> <td valign="top">106,213 </td> <td class="red">-31.4% </td> <td valign="top">237 </td> <td valign="top">346 </td> </tr> <tr> <td class="yellow"> COMPANIES</td> <td class="yellow">
</td> <td class="yellow">
</td> <td class="yellow">
</td> <td class="yellow">
</td> <td class="yellow">
</td> <td class="yellow">
</td> </tr> <tr> <td valign="top">BMW Group</td> <td class="red">-9.7%
</td> <td valign="top">303,190
</td> <td valign="top">335,840
</td> <td class="red">-10%
</td> <td valign="top">984
</td> <td valign="top">1,094
</td> </tr> <tr> <td valign="top">Chrysler LLC</td> <td class="red">-30% </td> <td valign="top">1,453,122 </td> <td valign="top">2,076,650 </td> <td class="red">-30.3% </td> <td valign="top">4,717 </td> <td valign="top">6,764 </td> </tr> <tr> <td valign="top">FoMoCo</td> <td class="red">-20.7% </td> <td valign="top">1,988,376 </td> <td valign="top">2,507,366 </td> <td class="red">-30% </td> <td valign="top">6,456 </td> <td valign="top">8,167 </td> </tr> <tr> <td valign="top">General Motors</td> <td class="red">-22.9% </td> <td valign="top">2,980,688 </td> <td valign="top">3,866,620 </td> <td class="red">-23.2% </td> <td valign="top">9,678 </td> <td valign="top">12,594 </td> </tr> <tr> <td valign="top">Honda America</td> <td class="red">-7.91%
</td> <td valign="top">1,428,765
</td> <td valign="top">1,551,542
</td> <td class="red">-8.21%
</td> <td valign="top">4,369
</td> <td valign="top">5,054
</td> </tr> <tr> <td valign="top">Nissan NA</td> <td class="red">-10.9% </td> <td valign="top">951,350 </td> <td valign="top">1,068,238 </td> <td class="red">-11.2% </td> <td valign="top">3,081 </td> <td valign="top">3,480 </td> </tr> <tr> <td valign="top">Toyota Mo Co</td> <td class="red">-15.4%
</td> <td valign="top">2,217,662 </td> <td valign="top">2,620,825 </td> <td class="red">-15.7% </td> <td valign="top">7,200 </td> <td valign="top">8,537 </td></tr></tbody></table>
Race Director
iTrader: (1)
Joined: Oct 2006
Posts: 11,395
Likes: 0
From: Charlotte(home) /Raleigh (school), NC
Thanks. 
Mini and Subaru at least did well. Honda didnt too bad for the year probably because of all the civics they sold over the summer. Audi is doing a good job for the year as well probably due to the new designs. WV is also down by very little. Hummer and Saab need to be sold.
Mini and Subaru at least did well. Honda didnt too bad for the year probably because of all the civics they sold over the summer. Audi is doing a good job for the year as well probably due to the new designs. WV is also down by very little. Hummer and Saab need to be sold.

Thread
Thread Starter
Forum
Replies
Last Post
rseb4agze
Car Parts for Sale
10
May 3, 2016 07:41 AM
InFaMouSLink
Car Parts for Sale
7
Oct 27, 2015 06:51 PM
Silvermoon_Knight
Car Parts for Sale
3
Oct 22, 2015 06:25 PM
sockr1
Car Parts for Sale
22
Oct 1, 2015 01:31 AM
