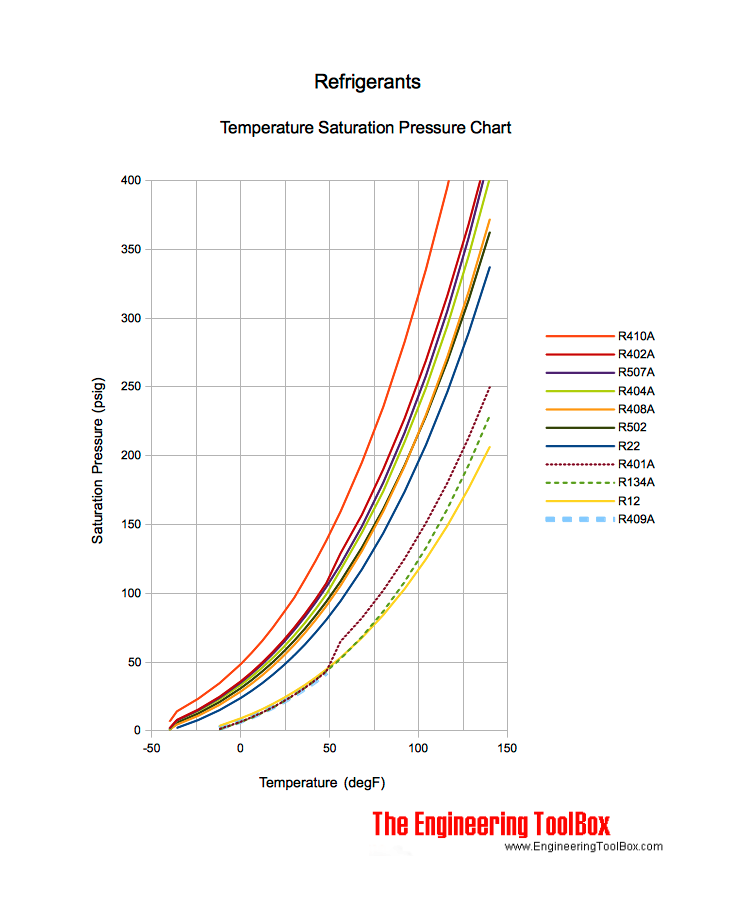
A/C Pressure vs Temperature Chart or Graph

Thread Tools
 
Search this Thread
 
Old 07-20-2019, 06:28 AM
  #1  
Burning Brakes
Thread Starter
 
Tech's Avatar
 
Join Date: May 2017
Location: Right Here
Posts: 1,233
Received 390 Likes on 236 Posts
A/C Pressure vs Temperature Chart or Graph

Does anyone have the factory pressure vs temperature chart or graph for an RDX (2017)?
Old 07-19-2023, 01:21 PM
  #2  
Cruisin'
 
jcolegrove's Avatar
 
Join Date: May 2021
Age: 55
Posts: 19
Likes: 0
Received 1 Like on 1 Post
How about 4 yrs later? Any suggestions? Been looking for a while...
Old 07-19-2023, 06:21 PM
  #3  
Three Wheelin'
 
altair47's Avatar
 
Join Date: Jun 2016
Age: 33
Posts: 1,253
Received 356 Likes on 284 Posts
Originally Posted by jcolegrove
How about 4 yrs later? Any suggestions? Been looking for a while...
This graph is the same for all cars

Last edited by altair47; 07-19-2023 at 06:24 PM.
The following users liked this post:
Kelsen (07-20-2023)
Old 07-20-2023, 06:49 AM
  #4  
Cruisin'
 
jcolegrove's Avatar
 
Join Date: May 2021
Age: 55
Posts: 19
Likes: 0
Received 1 Like on 1 Post
Thanks, but I was asking for the manifold pressure/ temp chart that is in the FSM.
Related Topics
Thread
Thread Starter
Forum
Replies
Last Post
Black Tire
Money & Investing
31
09-06-2011 08:22 PM
PsychDoc
Car Talk
67
05-21-2011 09:11 PM
soopa
Sports Talk & Fantasy Leagues
9
11-10-2006 02:07 PM
Junkster
Sports Talk & Fantasy Leagues
258
06-17-2004 08:08 PM


Quick Reply: A/C Pressure vs Temperature Chart or Graph


All times are GMT -5. The time now is 12:00 AM.